Spire.Cloud.PowerPoint has the ability to create a PowerPoint document from scratch as well as editing existing ones. Almost all document elements are supported, including slides, tables, charts, shapes, images, hyperlinks, lists, comments, hyperlinks, backgrounds, WordArt, textboxes, slide layouts, and equations.
Supported Document Formats
PDF / WORD / EXCEL / POWERPOINT / TXT / MARKDOWN / HTML
Spire.Cloud.PowerPoint has the ability to create a PowerPoint document from scratch as well as editing existing ones. Almost all documentelements are supported, including slides, tables, charts, shapes,images, hyperlinks, lists, comments, hyperlinks, backgrounds, WordArt, textboxes, slide layouts, and equations.
Document Editing
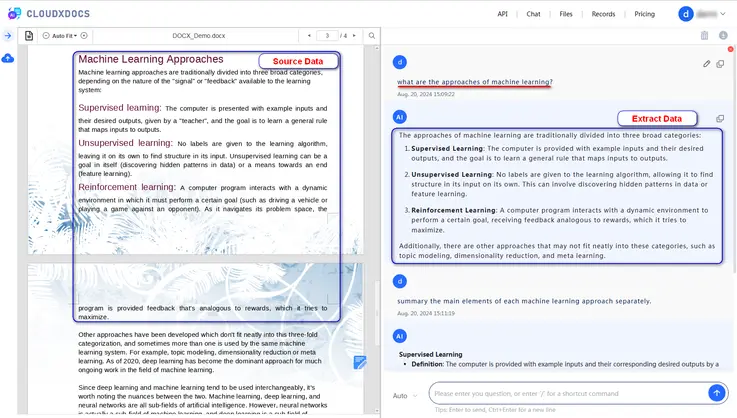
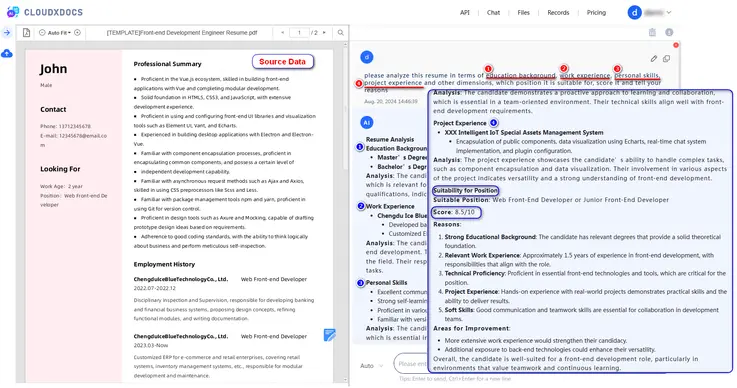
Spire.Cloud.Word offers the ability to create a Word document from scratch as well as editing existing ones. Almost all document elements are supported, including sections, pages, headers & footers, paragraphs, lists, tables, hyperlinks, bookmarks, Word Arts, comments, images, textboxes, formulas, and table of contents.
Spreadsheet Editing
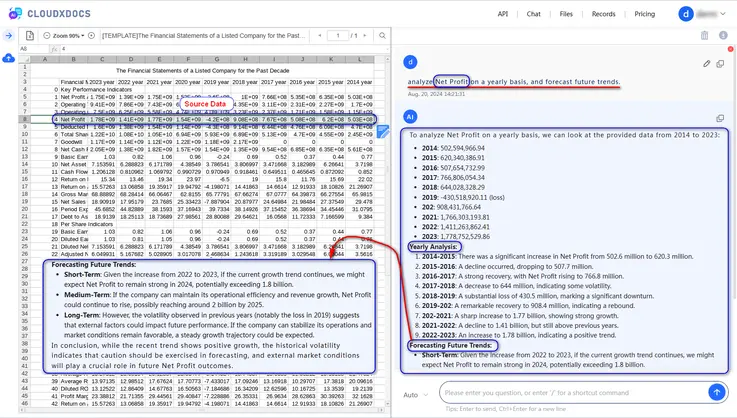
Spire.Cloud.Excel is capable of creating Excel files from scratch and editing existing ones. Almost all Excel elements are supported, including worksheets, rows and columns, cells, formulas, equations, symbols, charts, shapes, hyperlinks, comments, tables, WordArt, images, document properties, pivot tables, page layouts, backgrounds, borders and many more.
 Editing Slides